↖Raw Exposure, Download, Help, Support
Raw value histogram basics
The graph displayed in Raw Exposure next to the photo preview is the raw value histogram. It represents the distribution of unprocessed raw values1 in a raw image file. The raw value distribution reflects the light distribution on sensor since a raw value is proportional to the amount of light received by a pixel. The horizontal axis has log to the base 2 scale (the photographic scale). Every raw value doubling, which is equivalent to an exposure stop, is marked by a vertical line. This allows to correspond the graph with the shot exposure parameters easily.
For example, the two photos are taken with identical parameters except the two times slower shutter speed in the second photo. In the result the graph is shifted one stop to the right.
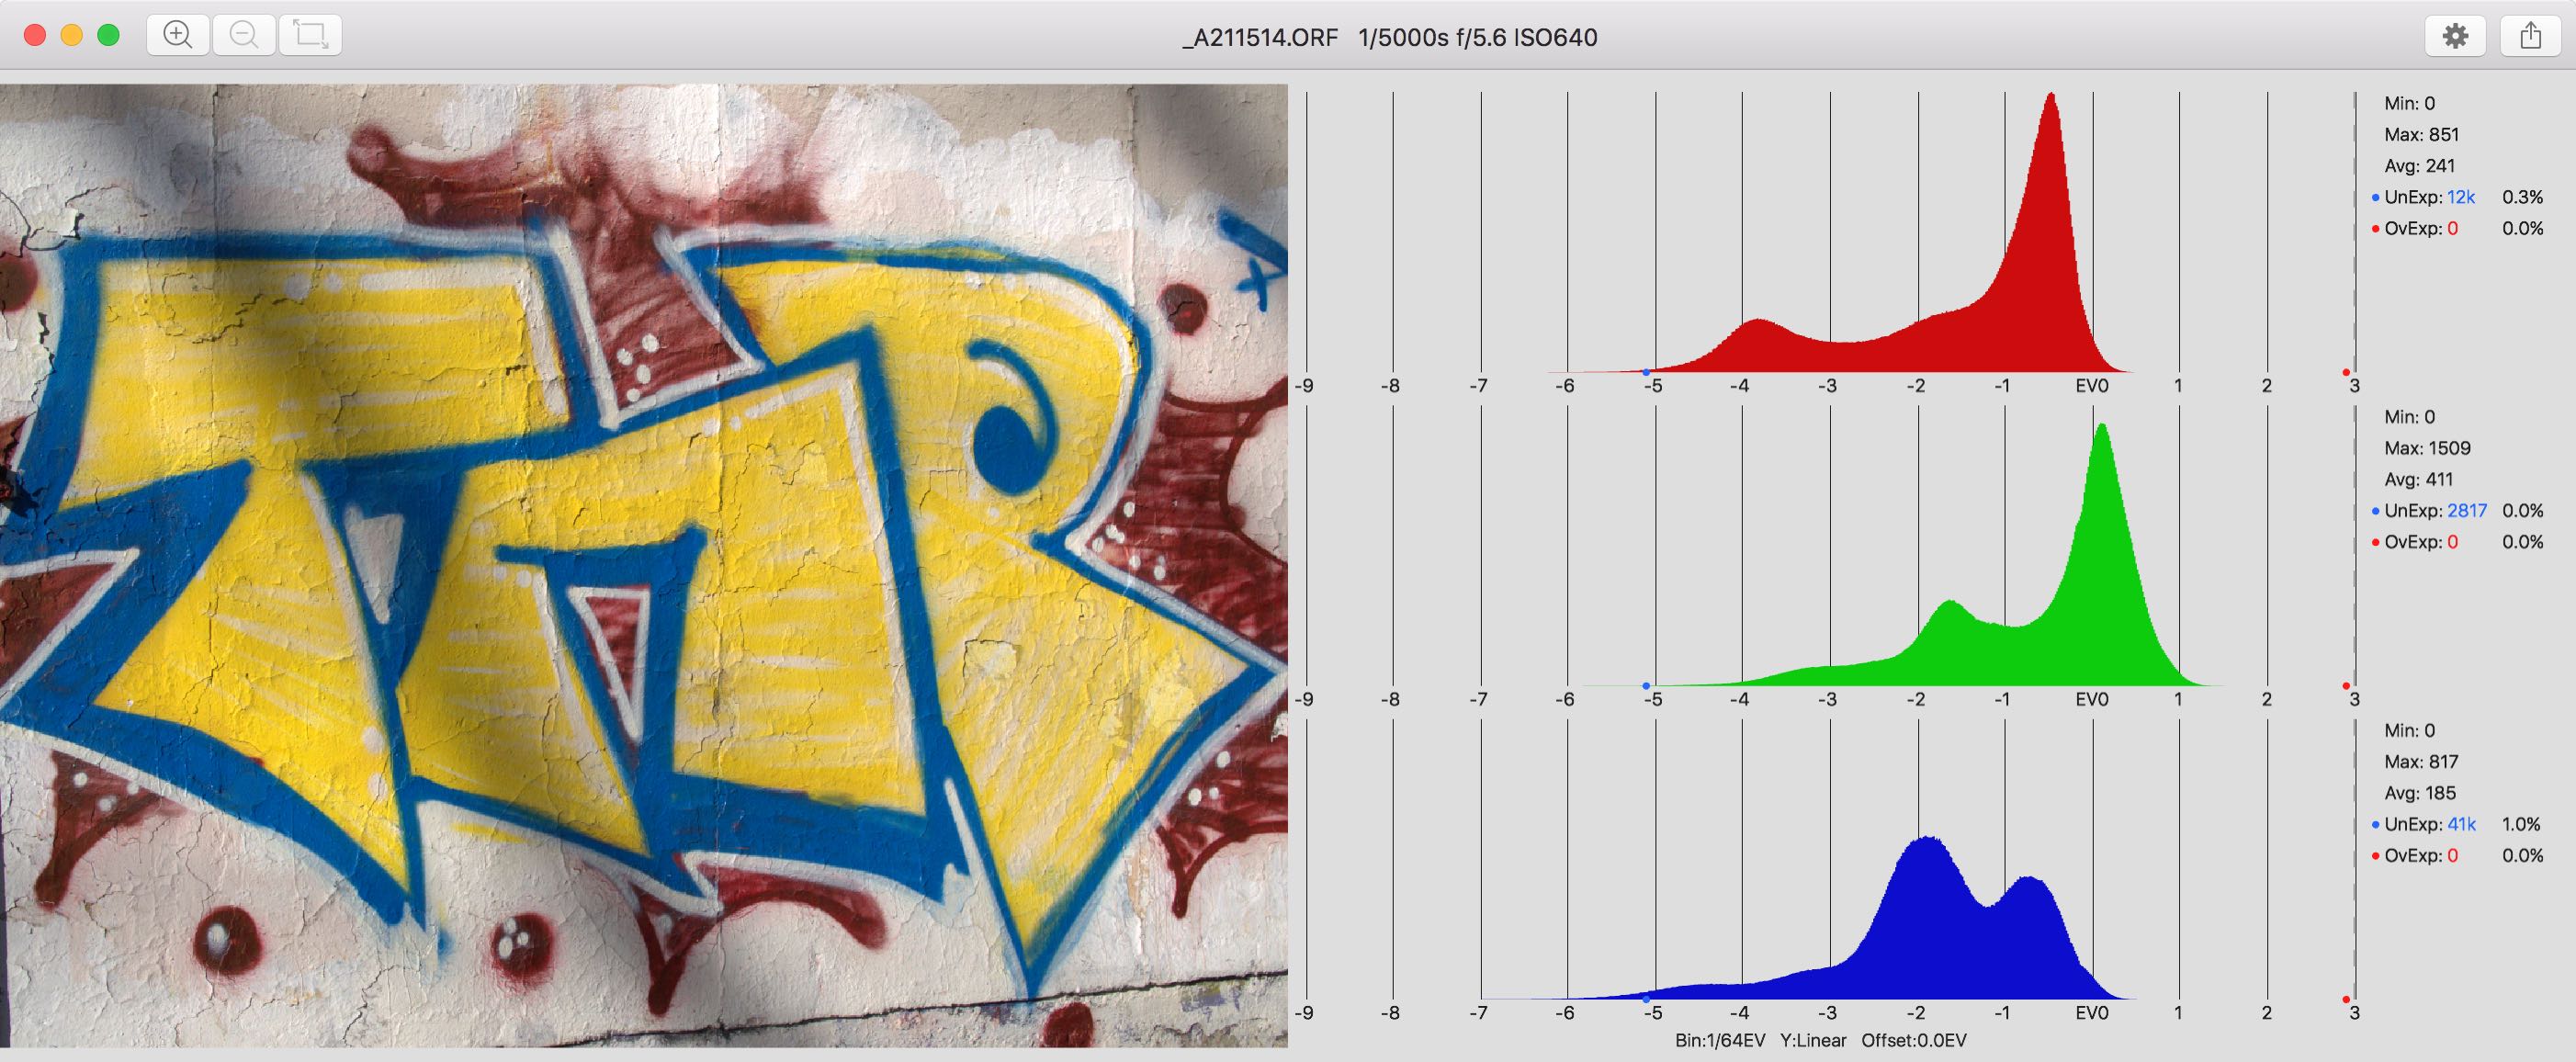
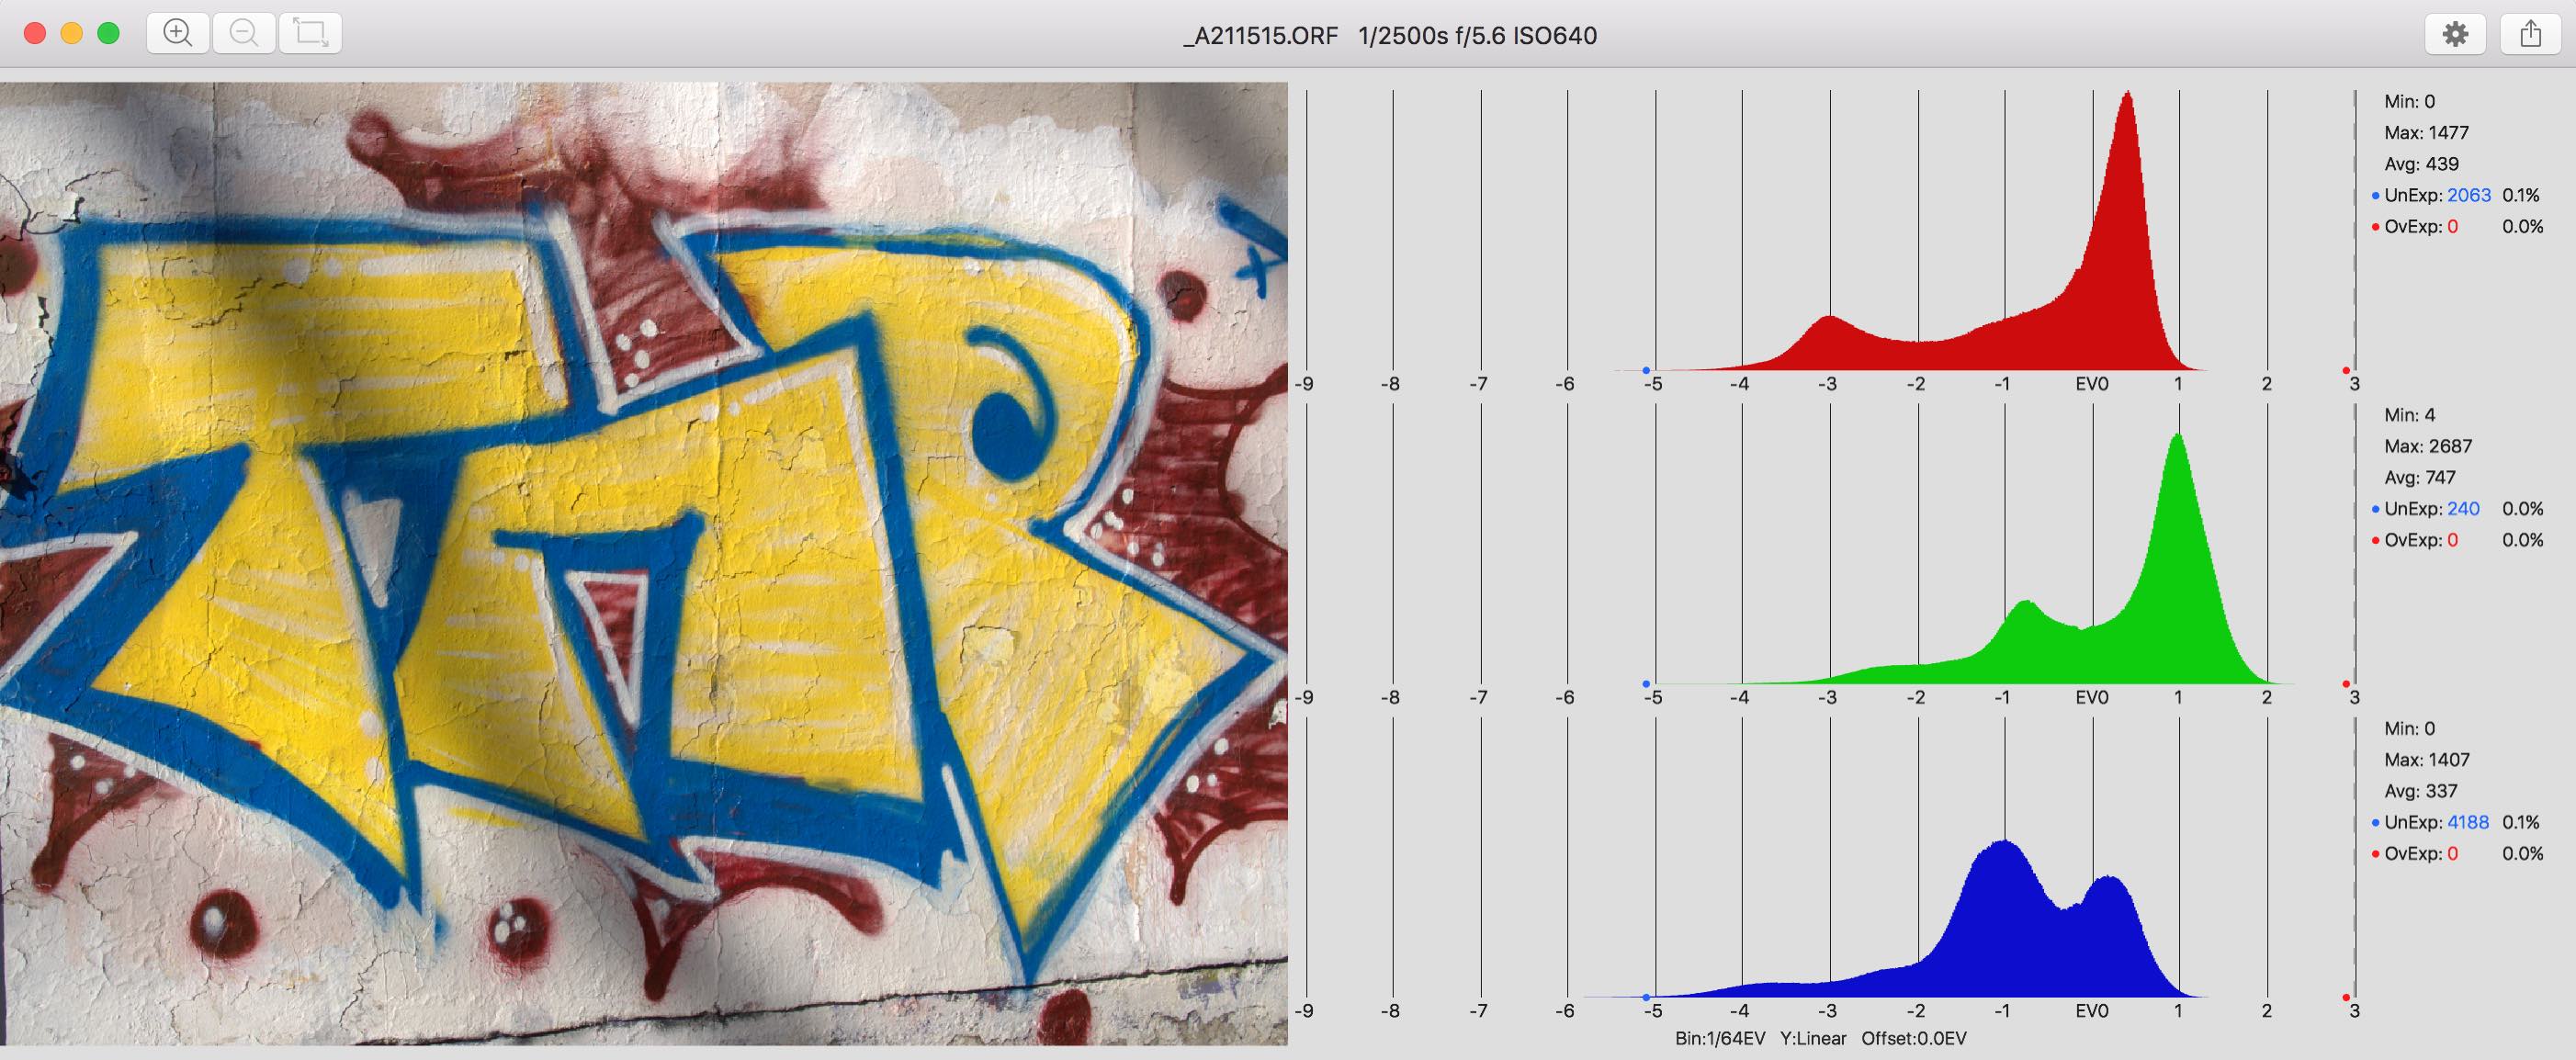 The second image received two times more light than the first one.
One practical raw value histogram application is the exposure quality assessment. In the above example the first photo has about 2 stops of underexposure, the second has about 1 stop. The larger the gap from the right edge of the histogram to the saturation point the more sensor capabilities are wasted.
Another application is the photographed scene dynamic range estimation. This is the distance between the left and the right histogram graph tail ends. In the example, the first photo has very narrow range of intensities. The second is a typical landscape photo, about 6-7 stops intensity range.
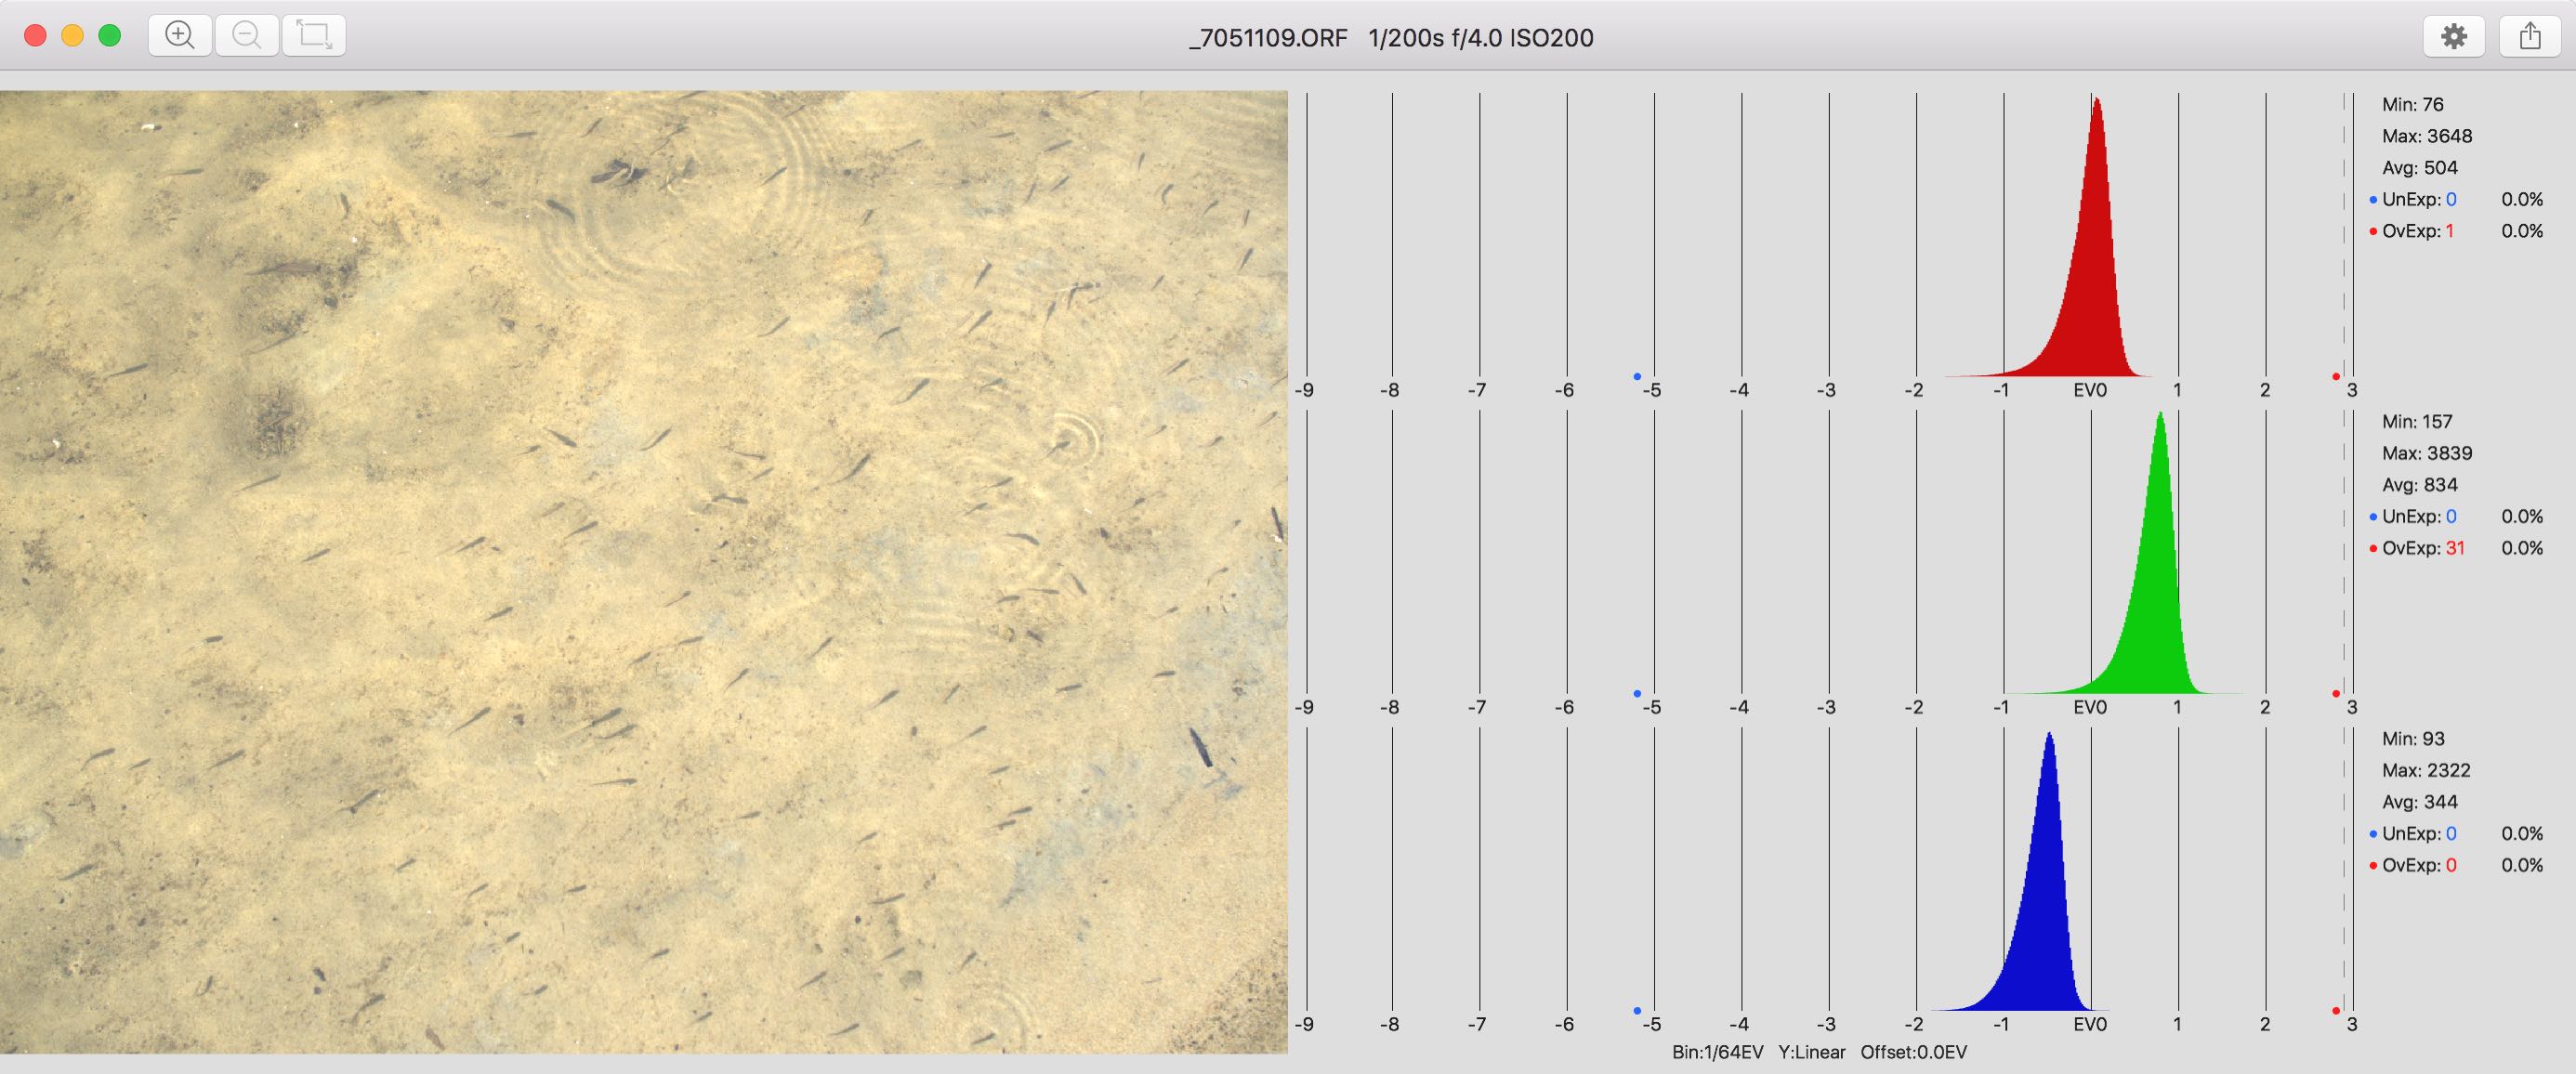
 The scenes with different intensity ranges.
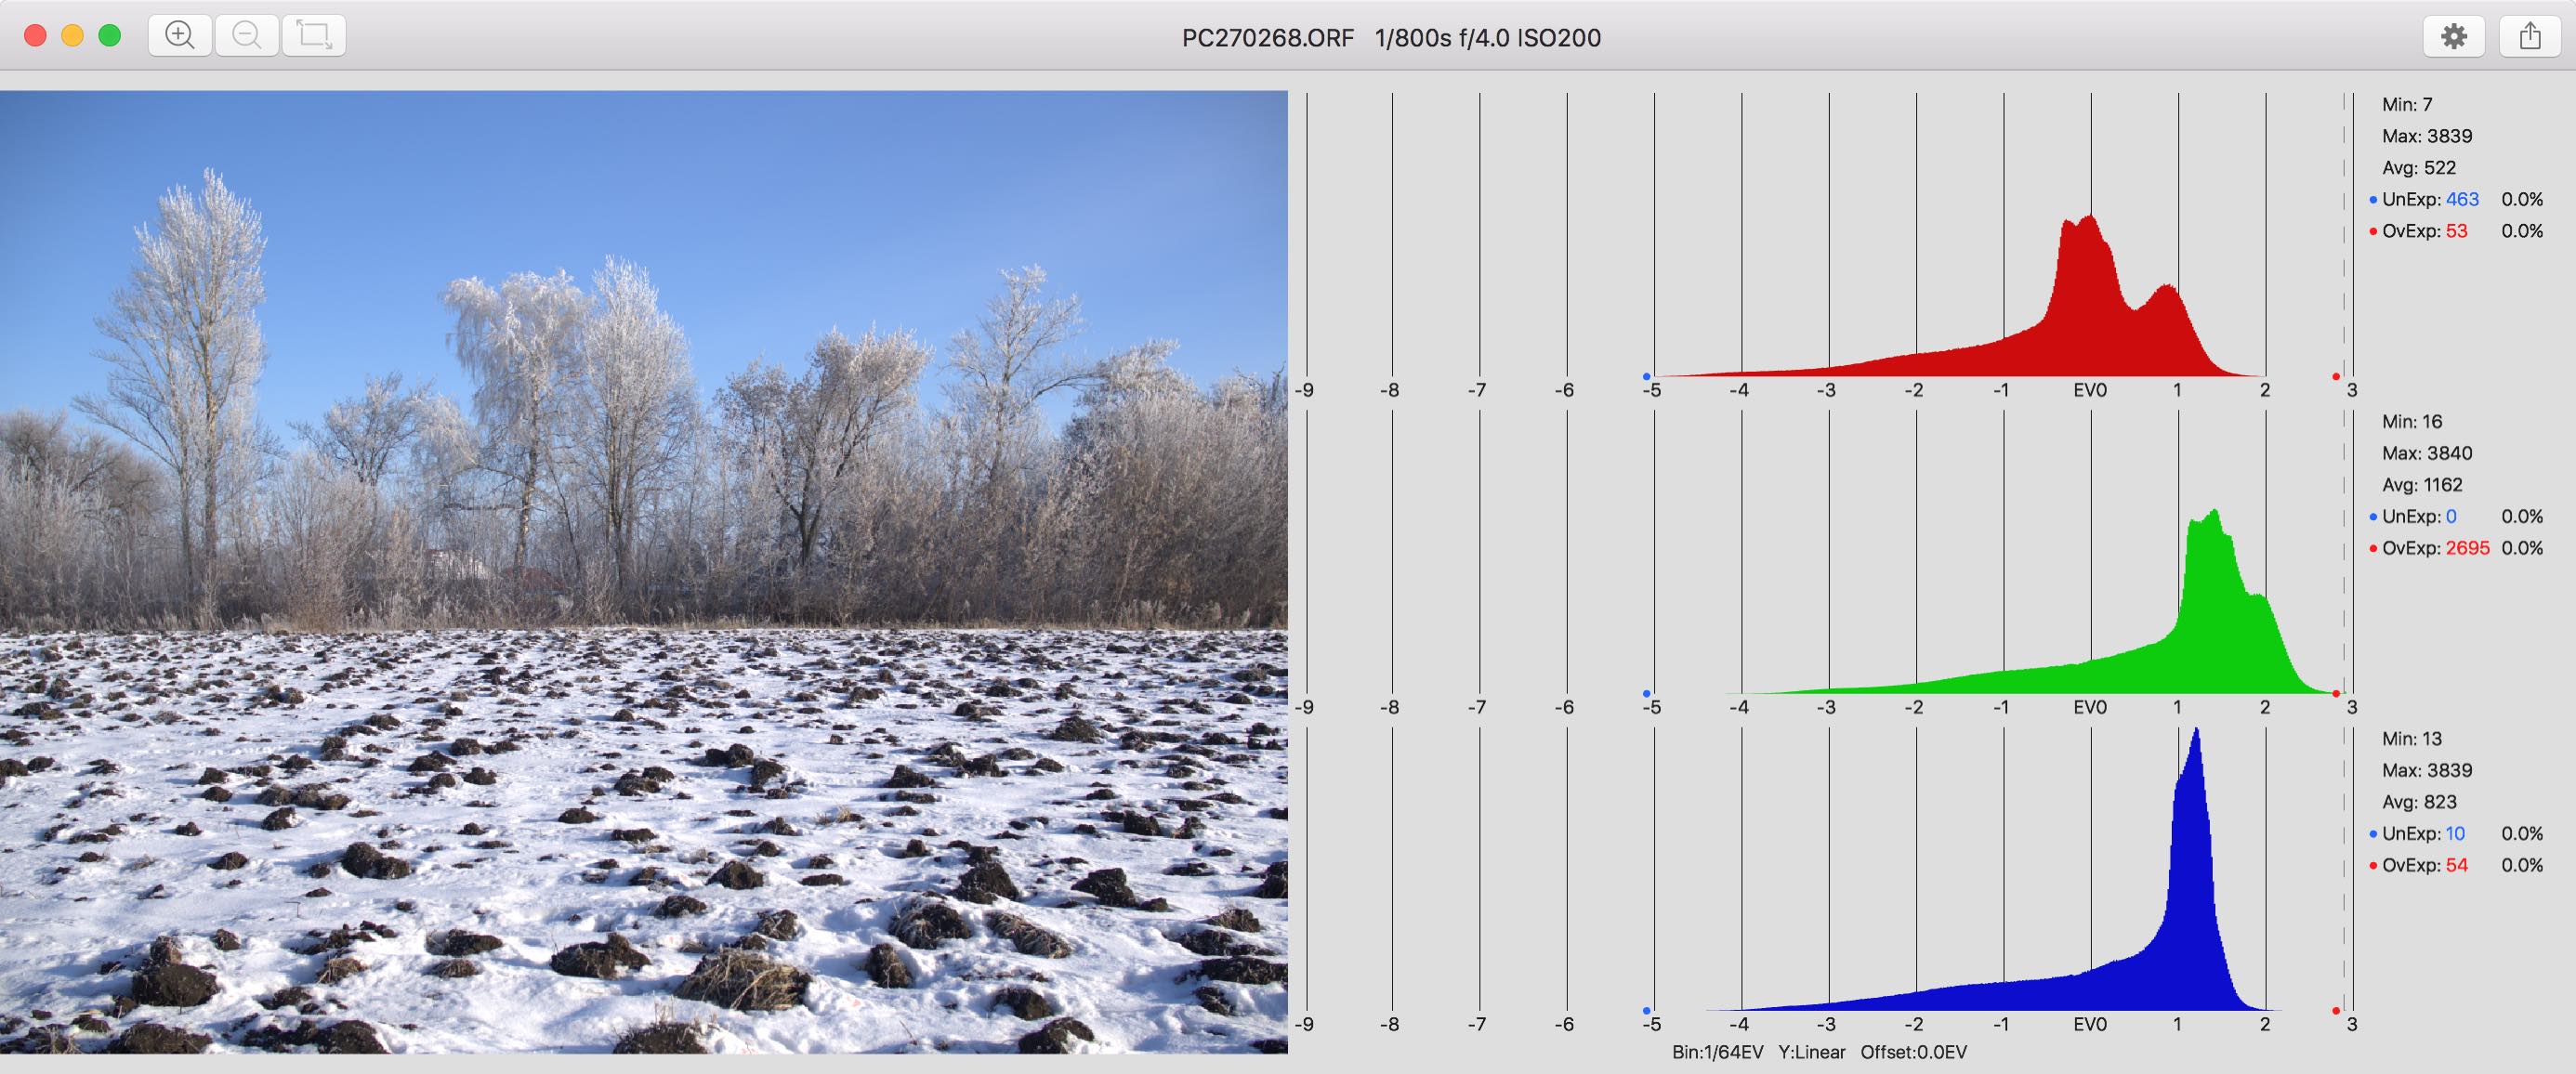
In the next example the photo contains two rather homogeneous parts, the sky and the earth. Its raw histogram consists of two peaks, about 2 stops in width each, with 5 stops in between. On the average the sky is 5 stops brighter that the earth on this photo. That way using a raw histogram one can estimate relative intensities within the scene. Raw histogram turns your camera into a highly accurate light meter.
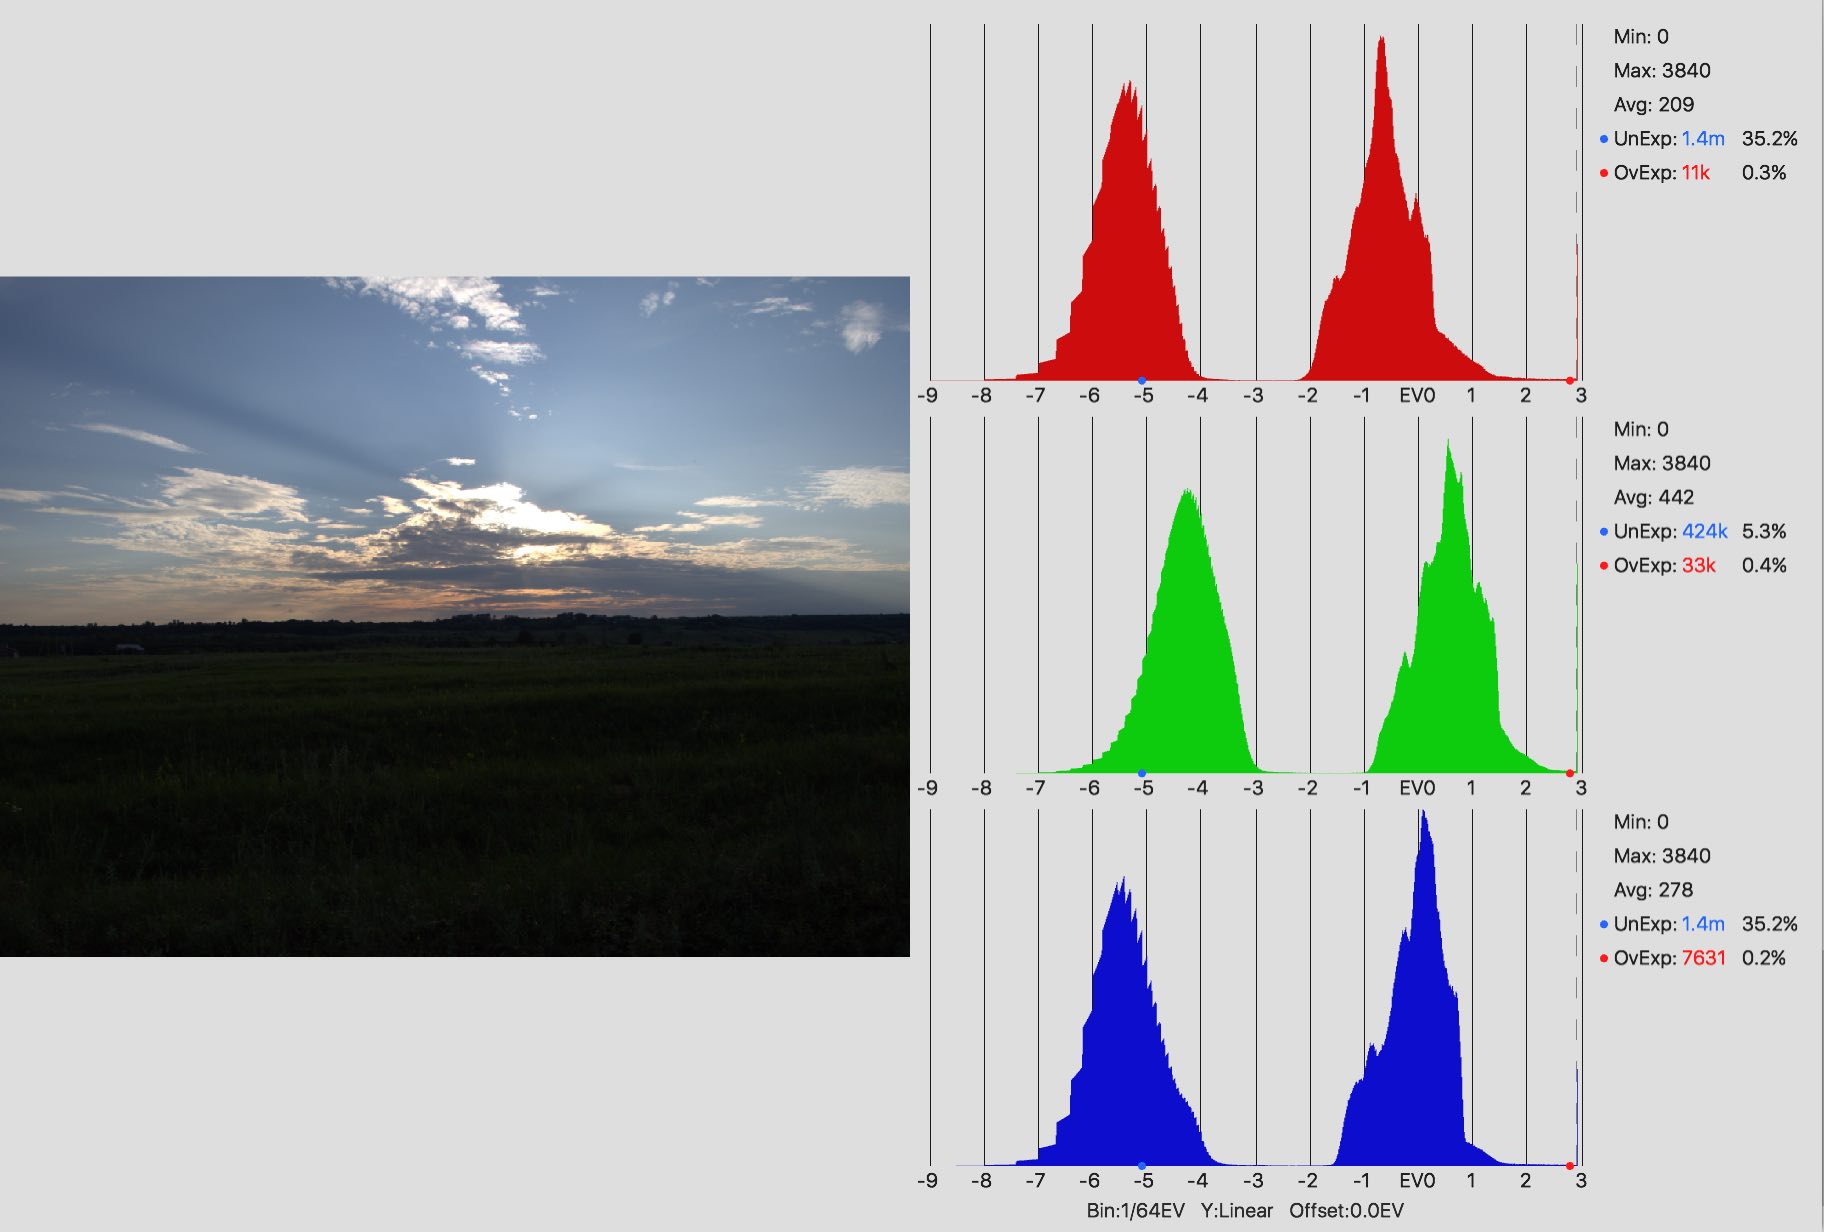 The raw histogram clearly shows the sky is about 5 exposure stops brighter that the earth.
Compare this to the histogram built from the image after raw conversion. It is a nonlinear transformation and the processed image pixel intensities are no longer proportional to the amount of light. The purpose of the processed image histogram is different. It visualizes the effects of image processing operations such as the exposure compensation, the white balance correction etc.
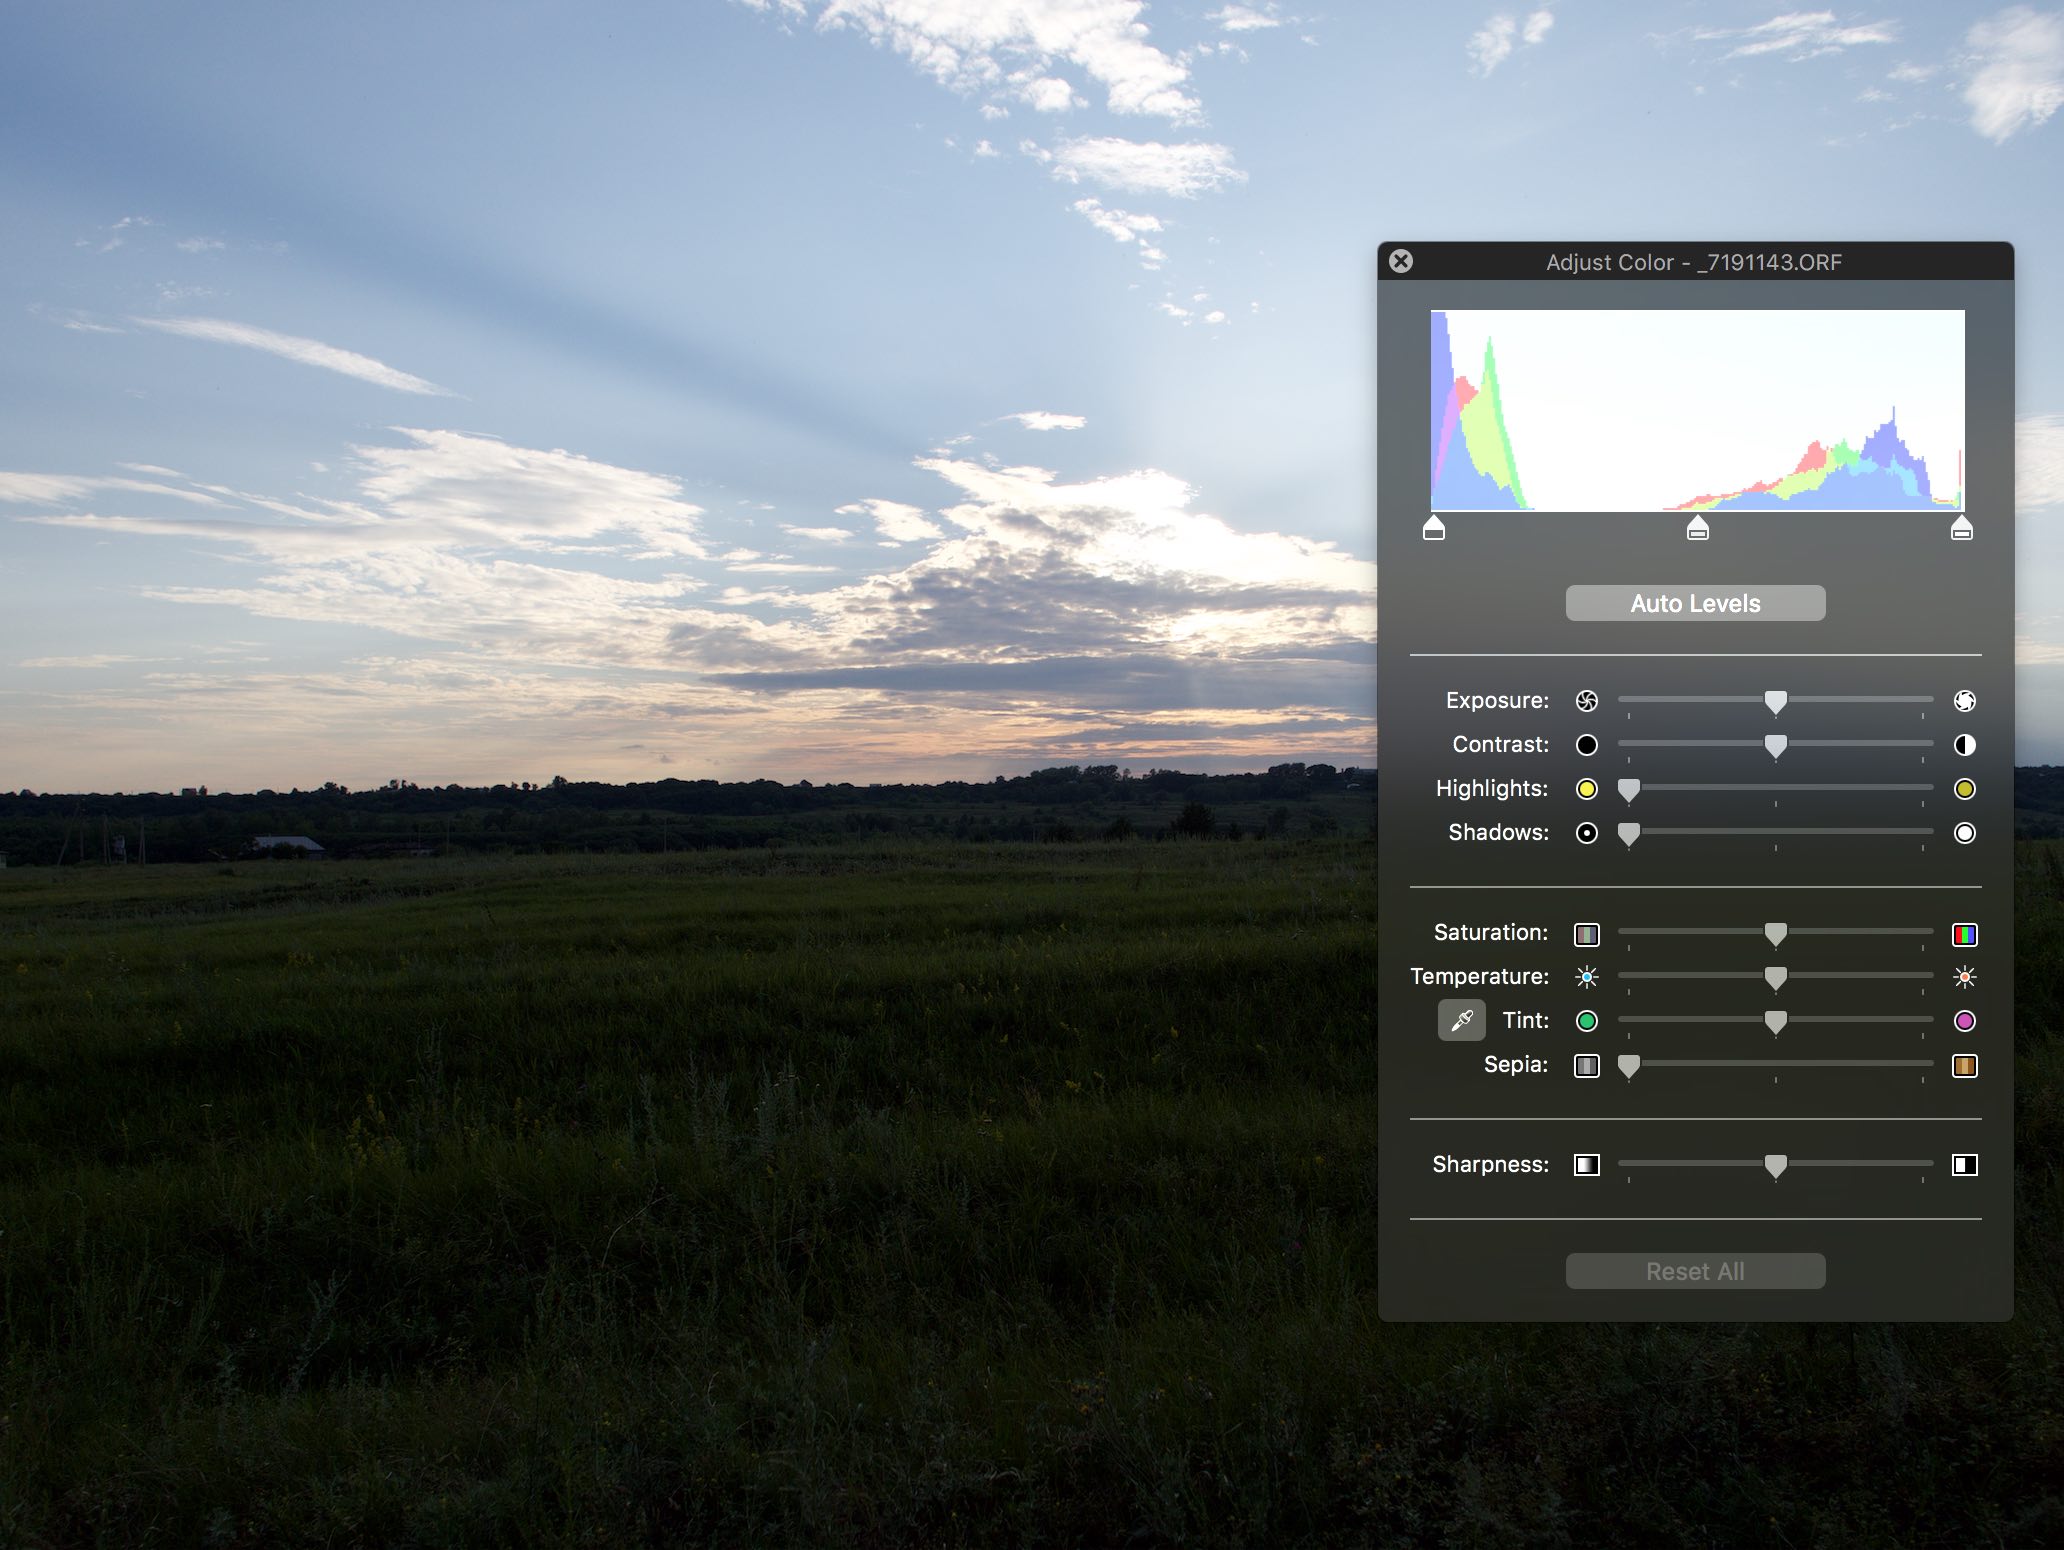 The pixel intensity histogram of the same image after raw conversion (Mac OS X Preview).
Raw files contain a wealth of information about the photographed scene and the real shot exposure. With a help of raw value histogram you can put this information to a good use.
-
Actually the raw values after black level subtraction are used (the values below the black level is considered as noise). ↩
|
Follow @boltnevstudio
Copyright 2010-2016 Alexander Boltnev, Olga Kacher. |
|
 Focus Stacker
 Panorama Stitcher
  Print To Scale